 PARAMOUNT MATTER
Evidence first. Capital follows.
Exploration is a series of decisions made under uncertainty. At each stage we ask what the evidence shows and what the next test should be, so that good ground keeps moving forward.
Satellite demonstration
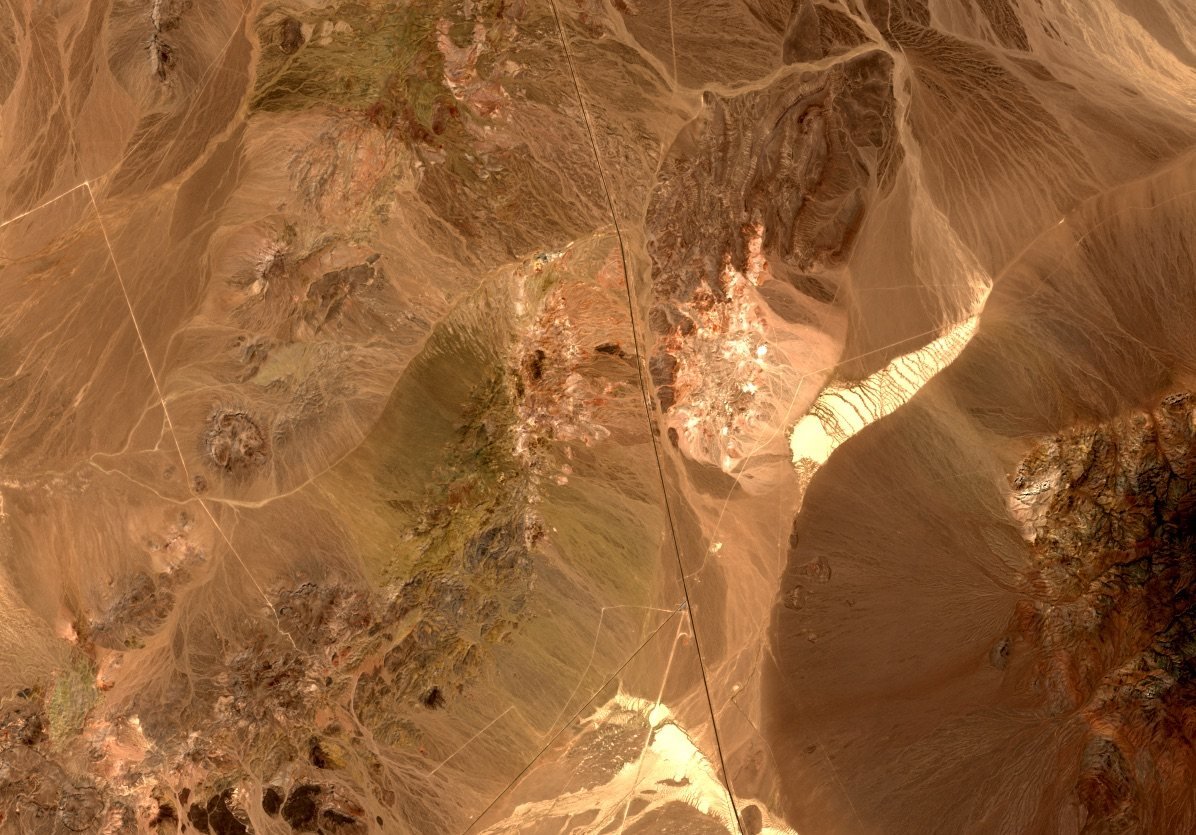
 Natural colour
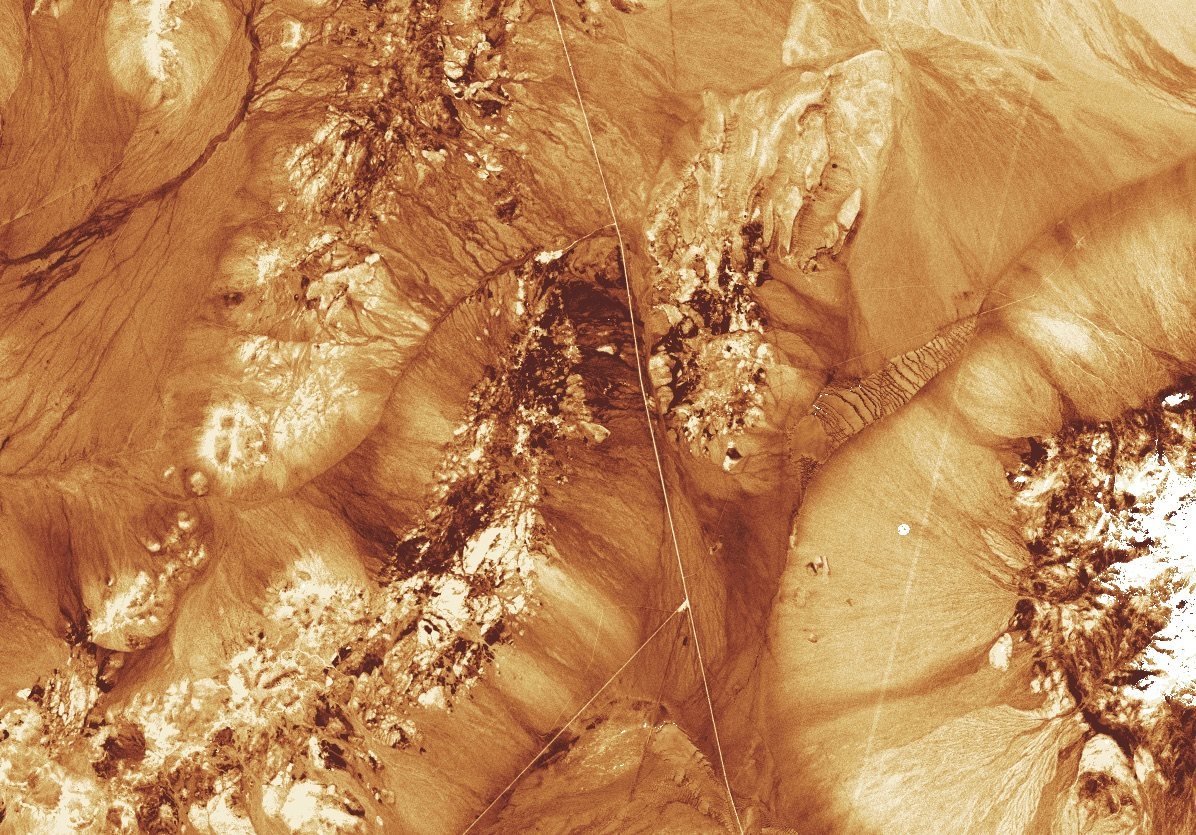
Iron-oxide response
A clue to iron oxides.
Band ratio B04 / B02 (red over blue). High values suggest ferric iron: a gossan (the iron-rich cap left where sulphides have weathered) or ordinary weathering. Look for coherent patterns on exposed rock, then compare with the hydroxyl response and mapped faults.
Iron-rich soil, transported material and ordinary weathering can give the same response.
Does this response come from weathered sulphide-bearing rock, from ordinary iron-rich rock, or from soil and transported material?
A threshold relative to the area shown, not a probability of mineralisation. Both ratios come from the same scene, so their agreement is not independent confirmation.
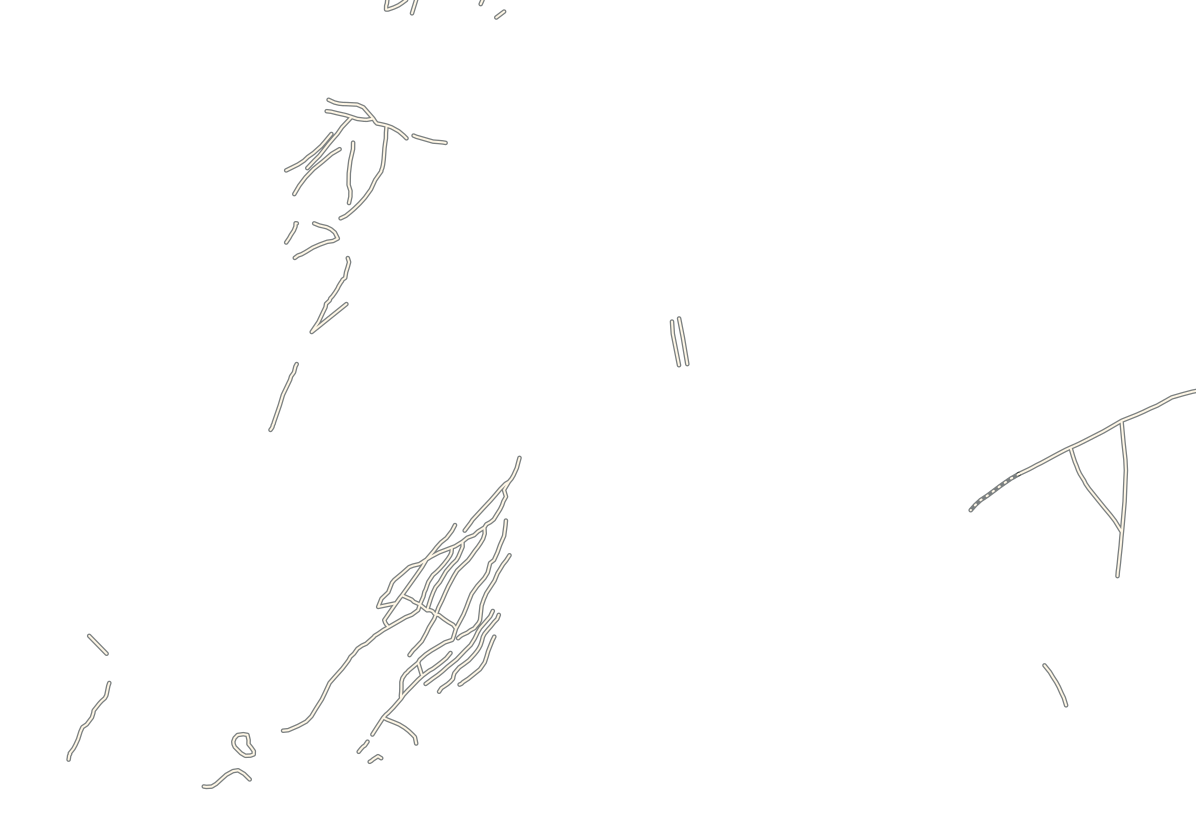
White areas in the All view were screened out for data quality or vegetation. They are not evidence of absence. Faults: solid where known, dotted where concealed; positions approximate.
Click the image to read both ratios at that point. With a keyboard, focus the image and press Enter, then move the marker with the arrow keys.
Tap the image to read both ratios at that point. Drag sideways to move the divider.
Screened out. No reading at this point.
- Iron oxide · B04 / B02
- Hydroxyl · B11 / B12
Ratios of reflectance, not metal grades.
Cuprite is arid and its rocks are well exposed. In deeply weathered or vegetated terrain the same band ratios show far less, which is why the other kinds of evidence matter.
Each stage has to earn the next.
- Desk study
- Published maps
- Regional data
- Satellite imagery
- Elevation data
- Regional geophysics
- Field mapping
- Geochemistry
- Geophysics
- Trenching
- Drilling
- Assaying
- Four maps. Each after the first enlarges the boxed part of the one before it ten times: a belt about 1,000 kilometres across, an area of about 100 kilometres, a target of about 10 kilometres and a prospect of about one kilometre. The same structure runs through all four.
- Stage 1Start with the beltBelt1,000 km
Why could a mineral system exist here?
Tectonic setting and deposit model come first.
- Desk study
- Published maps
- Regional data
Relative costSelect areas with a coherent geological case.
- Stage 2Read the surfaceArea100 km
Do the surface patterns fit that model?
Possible alteration, candidate structures and rock units, read from satellite data and regional geophysics.
- Satellite imagery
- Elevation data
- Regional geophysics
Relative costPrioritise places to inspect.
- Stage 3Cross-checkTarget10 km
What supports the model, and what contradicts it?
Independent evidence from field mapping, geochemistry and geophysics.
- Field mapping
- Geochemistry
- Geophysics
Relative costRank targets by geological fit, and state what is still unknown.
- Stage 4Test and refineProspect1 km
Which test would change the decision?
Detailed sampling and trenching, then drilling and assay when justified.
- Trenching
- Drilling
- Assaying
Relative costDecide the next step on the evidence.
Why could a mineral system exist here?
Tectonic setting and deposit model come first.
Select areas with a coherent geological case.
Do the surface patterns fit that model?
Possible alteration, candidate structures and rock units, read from satellite data and regional geophysics.
Prioritise places to inspect.
What supports the model, and what contradicts it?
Independent evidence from field mapping, geochemistry and geophysics.
Rank targets by geological fit, and state what is still unknown.
Which test would change the decision?
Detailed sampling and trenching, then drilling and assay when justified.
Decide the next step on the evidence.
A vertical slice along the line A to A′ on the fourth map. Soil and weathered rock lie over fresh rock, deeper along the structure. Satellite data read only the ground surface, and soil samples come from the top metre or so: only drilling reaches fresh rock. The structure is dashed and ends in a question mark because its course at depth is not known. The two holes are placed to cross it at two depths below the weathered rock.
- Volcanic and sedimentary belt
- Granitoid
- Younger cover
- Structure, interpreted
- Rock contact or minor fault
- Satellite response, low to high
- Place to inspect
- Taken to the next stage
- Soil sample, background to anomalous
- Outline of a soil anomaly
- Geophysical anomaly
- Target, numbered by rank
- Trench
- Base of weathering
- Line of the section
- Drill hole, from collar to end
Symbols are drawn larger than life so that they can be read: a satellite pixel is 10 to 30 metres across, and soil samples are far closer together than shown.
The last map shows a first test being laid out, not a result. The bars show the order of cost, not its size. The cheap tests come first, so that the expensive ones are kept for the ground with the strongest case.
Five kinds of data. One multidisciplinary team.
Remote-sensing specialists, geophysicists, geochemists, field geologists and data scientists work on the same ground as one team. Each knows the limits of their own evidence. The target list is built together.
The question comes first
What kind of deposit could this ground hold, and what would each kind of data show if it did?
The geological model decides which data are worth collecting, and in what order.
Satellite imagery
Indicates which mineral groups may be exposed at surface. Says nothing about what lies under cover or vegetation, or about grade.
Radar and elevation
Shows landforms and candidate structures, even under cloud. Cannot say whether a structure ever carried mineralising fluid.
Geophysical surveys
Show contrasts in physical properties at depth. Each anomaly has several possible sources until geology narrows them.
Geochemical sampling
Measures metals and pathfinder elements (those that accompany the target metal) in soil, sediment and rock. Cannot give the depth, size or continuity of the source.
Field geology and drilling
Mapping tests rock and structure where rock is exposed. Drilling tests them, and grade, at depth. One drill hole tests one line through the ground: it neither proves nor rules out a target.
Read together
Targets built from independent lines of evidence, ranked by the whole team on geological fit, with the open questions stated.
| Reading | 1 | 2 |
|---|---|---|
| Satellite imagery | Response | Response |
| Radar and elevation | Response | No response |
| Geophysical surveys | Response | No response |
| Geochemical sampling | Response | No response |
| Field geology | Response | No response |
- All five readings show a response here: first in line for a field test.
- Only the satellite shows a response here: a question for the field.
Each field result goes back to the question. The model is revised, and the next data are chosen to test it.
Spectral and spatial analysis
Band ratios and spectral analysis turn imagery into maps of possible alteration and interpreted rock type.
Structural interpretation
We trace candidate faults, shear zones and contacts across imagery, elevation and geophysics to find where fluids could have moved.
Machine-learning integration
Models combine the layers and score areas for follow-up. Geologists test the rankings against field evidence.
We set out to advance projects, and we are clear about what the evidence shows.
Advance
Our aim is to take each project forward ourselves. Where the evidence supports the geological case, we can fund the next stage and carry out the work with our own technical team, on terms agreed with the partner in writing.
Refine
When a result is unclear, we redesign the test and try again. One unclear result is a reason to look again, not a verdict.
Report plainly
We share results with our partners as they are, including those that contradict the model, and agree the next step together.
Alongside the geology, logistics and cost, we assess legal rights, consent and access, and our responsibilities to communities and the environment.
Many targets do not become projects, and we say so when the evidence points that way. Nothing on this page establishes a discovery, a resource or a project value.
Do you hold ground that deserves a proper look?
See how we partner →